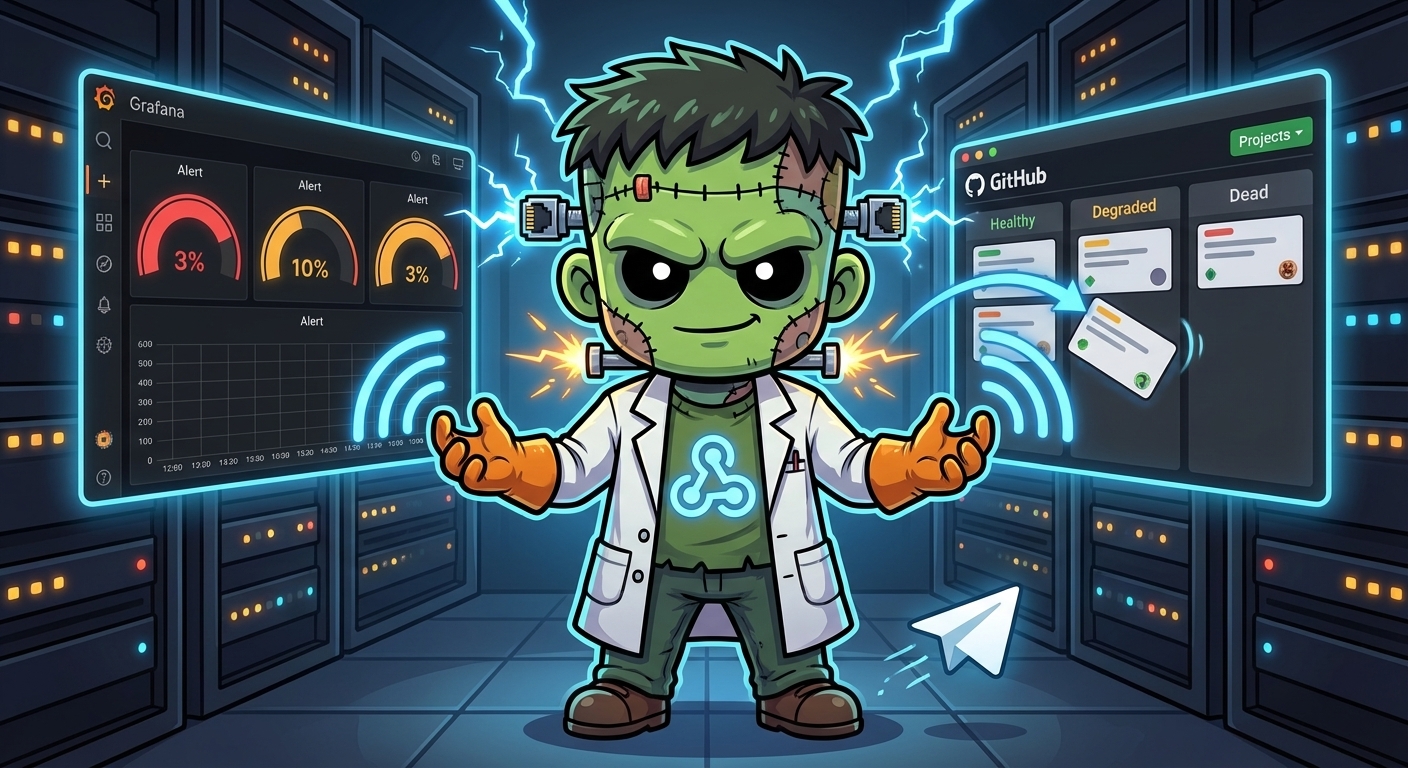
Health Bridge — Closing the Loop from Grafana Alerts to GitHub Issues
The previous post added feature-level health monitoring — Blackbox probes, Pushgateway heartbeats, and Grafana alerts to Telegram. But alerts only tell you something is wrong. They don’t update the project board, they don’t track which features are degraded, and they don’t create bug tickets when things die.
This post adds the final piece: a bridge service that maps Grafana alerts to GitHub Project lifecycle states. When an alert fires, the feature’s Issue on the project board moves from healthy to degraded or dead. When it resolves, it moves back to healthy. No manual triage needed.
The Problem
Frank’s monitoring stack already knows when features break. Grafana alert rules watch for stale heartbeats, failed probes, and missing pods. Telegram notifications arrive within minutes.
But the project board — a GitHub Projects v2 board with a custom “Lifecycle” field — still requires manual updates. Someone has to see the Telegram alert, open GitHub, find the right Issue, and change its lifecycle state. That’s exactly the kind of toil that should be automated.
Architecture
A stateless Go HTTP server sits in the monitoring namespace. Grafana’s notification policy routes alerts to it via webhook. The bridge parses each alert, extracts the github_issue label (e.g., willikins#11), maps the alert severity to a lifecycle state, and updates the GitHub Project item via GraphQL.
Grafana Alert Rule
       │
       ▼
Notification Policy
       │
       ├──▶ Telegram (continue: true)
       │
       └──▶ Health Bridge Webhook
                    │
                    ▼
            Parse github_issue label
                    │
                    ▼
            Map severity → lifecycle state
            ┌────────────────────────────┐
            │ resolved     → healthy     │
            │ firing/warn  → degraded    │
            │ firing/crit  → dead        │
            └────────────────────────────┘
                    │
                    ▼
            GitHub GraphQL API
            ├── Update Lifecycle field
            ├── Add Issue comment
            └── Create bug Issue (on dead)
The mapping is intentionally simple:
| Alert Status | Severity | Lifecycle State |
|---|---|---|
| resolved | any | healthy |
| firing | warning | degraded |
| firing | critical | dead |
On dead transitions, the bridge also creates a new bug Issue linked to the feature Issue — an automatic incident record.
The Service
Three Go files, no external dependencies beyond the standard library:
main.go — Entry point. Reads config from environment variables, creates the bridge, sets up HTTP routes:
POST /webhook— Grafana webhook receiverGET /healthz— Liveness probeGET /readyz— Readiness probe (checks project metadata is loaded)
bridge.go — Core logic. Handles webhook authentication (Bearer token), JSON parsing, alert processing, state mapping, and comment formatting. Each alert is processed independently — a failure on one doesn’t block others.
github.go — GitHub API client. On startup, loads project metadata via GraphQL (project ID, Lifecycle field ID, option IDs for each state). At runtime, finds the project item for an issue and updates its Lifecycle field. Uses REST API for issue comments and bug issue creation.
Webhook Authentication
Grafana sends a Bearer token in the Authorization header. The bridge validates it against the WEBHOOK_SECRET environment variable. This prevents unauthorized callers from changing lifecycle states.
authHeader := r.Header.Get("Authorization")
if authHeader != "Bearer "+secret {
    http.Error(w, "unauthorized", http.StatusUnauthorized)
    return
}
Alert-to-Issue Mapping
Each Grafana alert rule carries a github_issue label in the format repo#number:
| Alert Rule | github_issue |
|---|---|
| Exercise Reminder Stale | willikins#11 |
| Session Manager Stale | willikins#13 |
| Audit Digest Stale | willikins#12 |
| Agent Pod Not Running | frank#8 |
The bridge parses this label, finds the corresponding project item, and updates its lifecycle state.
Issue Comments
Every state transition adds a comment to the GitHub Issue with full context — alert name, severity, summary, timestamp, and a link back to Grafana. This creates an audit trail of health transitions directly on the issue.
Alert Deduplication (v0.2.0)
Grafana sends a webhook on every alert evaluation cycle (typically every few minutes). Without dedup, a persistently firing alert would create a new bug issue and comment on every cycle.
Two-layer dedup prevents this:
- In-memory state tracking — The bridge tracks the last known lifecycle state per issue reference. Comments and bug issues are only created on actual state transitions (e.g., healthy → dead), not on repeated evaluations of the same state.
- GitHub search before bug creation — As a restart safety net (in-memory state is lost on pod restart), the bridge searches for existing open bug issues with a matching title before creating a new one.
The lifecycle state update itself (the GraphQL mutation) remains unconditional — it’s idempotent, so repeated calls are harmless.
Deployment
The service runs as a single-replica Deployment in the monitoring namespace, managed by ArgoCD.
Configuration: Non-secret values (org name, project number, port) live in a ConfigMap. Secrets (GitHub PAT, webhook secret) come from Infisical via ExternalSecret.
Resources: The bridge is tiny — 10m CPU request, 16Mi memory request, 32Mi memory limit. The Go binary in a distroless image is under 15MB.
Health checks: Kubernetes liveness probe hits /healthz, readiness probe hits /readyz. The readiness probe returns 503 until the bridge has successfully loaded project metadata from GitHub.
Self-monitoring: The bridge’s own healthz endpoint is added to the Blackbox Exporter’s VMProbe, monitored by the same Grafana stack it feeds into. Dogfooding.
Grafana Configuration
Two changes to the existing alerting setup:
Contact point: A webhook contact point named “Health Bridge Webhook” sends to the cluster-internal URL http://health-bridge.monitoring.svc.cluster.local:8080/webhook with Bearer token authentication.
Notification policy: A new route catches all alerts from the “Feature Health” folder and sends them to the webhook. The existing Telegram routes have continue: true, so alerts still reach Telegram and the bridge.
Default receiver: grafana-default-email
Routes:
  severity=critical → Telegram (continue: true)
  severity=warning  → Telegram (continue: true)
  grafana_folder=Feature Health → Health Bridge Webhook
CI/CD
The health-bridge repo has a GitHub Actions workflow that triggers on version tags. It runs tests, builds the Docker image, and pushes to GHCR. The Kubernetes Deployment references a specific image tag — image updates require a manifest change in the frank repo, which ArgoCD picks up automatically.
git tag v0.1.0 → GitHub Actions → ghcr.io/derio-net/health-bridge:v0.1.0
                                          │
                                          ▼
                                  frank repo manifest
                                          │
                                          ▼
                                      ArgoCD sync
Verification
Sending a test firing alert:
curl -X POST http://health-bridge.monitoring.svc.cluster.local:8080/webhook \
  -H "Authorization: Bearer $WEBHOOK_SECRET" \
  -H "Content-Type: application/json" \
  -d '{"status":"firing","alerts":[{
    "status":"firing",
    "labels":{"alertname":"test","severity":"warning","github_issue":"willikins#11"},
    "annotations":{"summary":"Test alert"},
    "startsAt":"2026-04-04T18:30:00Z"
  }]}'
Response: {"processed": 1, "total": 1}. Issue #11 on the Derio Ops board moves to degraded, with a comment documenting the alert.
Sending a resolved alert moves it back to healthy. Round-trip verified.
What’s Next
The endpoint-down alert covers multiple targets but currently has no github_issue label — per-endpoint mapping to individual Issues is future work. Adding Prometheus metrics to the bridge itself (health_bridge_alerts_processed_total, health_bridge_github_errors_total) would enable dashboards on bridge throughput and error rates.
This completes M3 of the Work Lifecycle Tracking design. M1 set up the GitHub Projects board and lifecycle field. M2 added the monitoring probes and alerts. M3 closes the loop — monitoring signals now flow automatically into project state.
Pass 3: Wiring the Layer trackers (2026-04-20)
Sixteen days later, I came back with a question the first pass had ducked: what if the whole cluster — every architectural Layer, not just the agent crons — had a Grafana rule driving its Lifecycle tile on the board?
The “Derio Ops” project had 20 Layer tracker Issues sitting there with manually-set healthy statuses, quietly lying. The Bridge already existed; it was just starved of rules that targeted them.
Three concrete decisions
One alert rule per Layer, living as code. The rules live in apps/grafana-alerting/manifests/alert-rules-cm.yaml — file-provisioned, read on boot, reloaded by deleting the Grafana pod. No click-ops. Each rule follows the Grafana 12.x three-step A → B → C SSE format (data-source query → reduce → threshold) with labels.github_issue: "frank-ops#<LAYER>" attached.
Severity maps to lifecycle:
firing + warning→degradedfiring + critical→deadresolved→healthy
Critical gets reserved for the load-bearing layers — losing them means you lose the feedback loop itself. Observability, OS/HA, GitOps, Authentik (because forward-auth gates everything), and Traefik (because ingress gates everything external).
Multi-instance per rule. This was the biggest upgrade. The first instinct was to write “is this Layer up?” as a single aggregated scalar per rule. Two problems with that:
- Telegram notifications become useless — “Layer 3 is degraded” tells the operator nothing actionable.
- The GitHub comment added by the Bridge is equally empty.
The fix is to let refId A return a labeled series — one sample per pod/node/volume — and let the reducer preserve those labels through to the annotation template:
expr: 'kube_pod_status_ready{namespace="kube-system",pod=~"cilium-.*",condition="true"}'
# ...
annotations:
  summary: "L3 Cilium: pod {{ $labels.pod }} NotReady"
When two cilium pods fail simultaneously, Grafana fires two alert instances. The notification policy groups them; the Bridge’s existing lastState dedup collapses them into a single Lifecycle transition with the first instance’s annotation as the comment. Best of both worlds: Telegram shows both failing pods in one bundled message; the board gets one clean transition.
For the Observability layer itself — which has to alert on its own absence — two signals needed normalising into a single series (pod readiness for anything in monitoring, plus the Bridge’s self-probe). That’s what label_replace is for:
expr: |
  label_replace(
    kube_pod_status_ready{namespace="monitoring",condition="true"},
    "component", "pod/$1", "pod", "(.+)"
  )
  or
  label_replace(
    probe_success{instance="http://health-bridge.monitoring.svc.cluster.local:8080/healthz"},
    "component", "probe/health-bridge-healthz", "", ""
  )
annotations:
  summary: "L8 Observability: {{ $labels.component }} failing"
The label-format caveat
The Bridge’s ParseIssueRef splits on # and treats the left half as the bare repo name, then passes that to a GraphQL repository(owner, name) query. The owner is pinned to derio-net via env var. So labels have to be repo#number — not org/repo#number. Pass 1 of the board restoration (16 days earlier) had written the tracker Issue bodies with derio-net/frank#<N> in the docs section, which was technically misleading; in practice the rules and the Bridge only ever saw the short form.
Relocating the trackers
One pre-requisite came out of nowhere mid-way through. Every Bridge webhook call optionally writes a comment to the tracker Issue and, on dead transitions, creates a new bug-labelled Issue in the same repo. The board was org-private, but derio-net/frank (where the trackers lived) was public. That meant every flap would leak cluster-state signal — “Authentik is dead” — to the public web.
Fix: a new private repo derio-net/frank-ops, with the 20 trackers transferred into it. Opportunistic cleanup: transferred in Layer-number order so frank-ops#<N> == Layer N for every non-gap N (with closed placeholder Issues burning the dropped slots — Layers 7, 20, 21, 22, 23). GitHub auto-updated the board’s item references on transfer; zero manual fixup needed.
What didn’t survive first contact with reality
Several plan rules targeted metrics that aren’t being scraped (yet):
longhorn_volume_robustness— fell back tolonghorn-managerpod readiness for Layer 4.argocd_app_info— fell back to anyargocd-*pod readiness for Layer 6.longhorn_backup_target_*— substitutedkube_cronjob_status_last_successful_time(a proxy that catches “the backup job isn’t running” but not “the backup target is unreachable”) for Layer 9.
Those are documented as follow-ups on the trackers themselves — missing ServiceMonitors that, once added, will let the rules speak the truer signal.
A few cosmetic surprises too: Sympozium runs developer-team-* scheduled-task Job pods that naturally end in Completed/NotReady, so the Layer 12 pod regex needed tightening to the control-plane components only. vCluster control planes use StatefulSet naming (experiments-0) not the vcluster-.* prefix I’d guessed. And one of the pre-existing notification-policy matchers was broken (grafana_folder=Feature Health with a space and no quotes — the actual folder title is feature-health), which meant new Layer alerts wouldn’t have reached the Bridge via the routing path at all until it was fixed.
The payoff
The Derio Ops board now self-updates. Every layer’s tile shows its real, current health — driven by a rule that names the specific failing pod or node or endpoint. A cilium-agent pod flapping on mini-2 produces a Telegram message with “L3 Cilium: pod cilium-94msf NotReady” and a GitHub comment that points at kubectl -n kube-system describe pod cilium-94msf. The Layer 3 tile on the board goes degraded for the duration, then healthy again when the pod recovers.
Zero manual triage. And because the board finally reflects reality, it’s useful again — which was the original point.